It’s 3 AM on a Tuesday. Your Laravel application just went down. Customers can’t log in. Orders aren’t processing. Support tickets are accumulating in your inbox.
By the time your team arrives at 9 AM, six hours have passed. Six hours of lost revenue, damaged trust, and an escalating PR situation.
This scenario isn’t hypothetical—it happens more often than most business owners realize. According to Gartner research, the average cost of IT downtime is $5,600 per minute. For an e-commerce site processing $1M annually, even one hour of downtime translates to approximately $114 in direct revenue loss—and that’s before you factor in the hidden costs.
The real question isn’t whether you can afford 24/7 monitoring. It’s whether you can afford to operate without it.
What 24/7 Monitoring Actually Means
Many businesses believe they have “monitoring” because they occasionally check if their site loads. That’s not monitoring—that’s hoping.
Professional 24/7 monitoring for Laravel applications tracks multiple layers:
Application Availability
Is your site responding to requests?
We ping your application every 60 seconds from multiple geographic locations. If your site goes down, we know within one minute—not six hours.
Response Time Performance
Are pages loading within acceptable timeframes? Slow performance often precedes complete outages. We track response times and alert when they exceed normal thresholds.
Database Health
Are queries executing efficiently? Database bottlenecks are the leading cause of Laravel application slowdowns. We monitor query performance, connection pools, and lock contention.
Server Resource Usage
CPU, memory, and disk usage patterns tell us when your infrastructure is approaching capacity. This allows us to scale resources before users experience problems.
Error Rate Tracking
A sudden spike in 500 errors or exceptions signals deployment issues, database problems, or third-party API failures. Early detection means early resolution.
Background Job Processing
Are your queued jobs completing successfully? Failed background jobs often go unnoticed until they create cascading problems.
SSL Certificate Status
Certificate expiration can bring your entire site down instantly. We monitor validity and renew certificates before expiration.
Third-Party API Dependencies
External services fail. When they do, we need to know immediately so we can implement fallback strategies or notify users appropriately.
This comprehensive approach catches issues before they impact your users.
Real-World Impact: A Case Study
One of our clients operates a SaaS platform serving over 5,000 businesses. They experienced seemingly random slowdowns every few days. Users complained, but the internal team couldn’t reproduce the problem consistently.
Our 24/7 monitoring system revealed the pattern within 72 hours: during automated backup processes, database write locks were causing query timeouts. The backups ran at inconsistent times based on data volume, making the issue nearly impossible to catch through manual observation.
We restructured the backup process to use read replicas and adjusted timing to off-peak hours. The slowdowns disappeared completely.
Without continuous monitoring, this issue would have continued driving customers away—one frustrated user at a time.
The Domino Effect of Undetected Issues
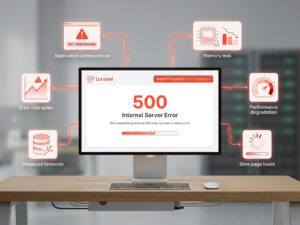
Downtime rarely announces itself with a clean, obvious failure. Instead, problems cascade through your application:
- A memory leak slowly consumes available server resources
- Application performance degrades gradually over hours or days
- Users experience slow page loads but don’t immediately report issues
- Database connections start timing out under load
- Error rates spike across the application
- The application becomes completely unresponsive
By the time you notice the problem, you’re dealing with a full outage and angry customers instead of addressing the initial memory leak quietly in the background.
Professional monitoring catches step one, not step six.
Proactive vs Reactive: The Cost Difference
Let’s compare two scenarios with real numbers:
Reactive Approach (No Monitoring)
- Issue discovered by customers calling support (reputation damage: immeasurable)
- Emergency debugging session: 4-8 hours at $200-500/hour = $800-4,000
- Lost revenue during 6-hour outage = $684 (for $1M/year business)
- Customer support overhead handling complaints = $500-1,000
- Potential customer churn (3-5 customers at $2,000 LTV) = $6,000-10,000
Total cost per incident: $7,984-15,684
Proactive Approach (24/7 Monitoring)
- Issue detected automatically within 2 minutes
- Alert sent to on-call team with diagnostic context
- Problem resolved before any customer impact
- Root cause documented for future prevention
Total cost: Included in $3,499/month maintenance plan
One prevented outage pays for 2-4 months of professional monitoring.
What Gets Monitored and Why It Matters
Uptime Monitoring
We check your application’s availability every 60 seconds from servers in North America, Europe, and Asia. This geographic distribution ensures we’re not getting false positives from regional network issues.
Why it matters: Every minute of downtime costs money. Instant detection means instant response.
Performance Monitoring
Page load times affect everything from user experience to Google search rankings. We establish baseline performance metrics and alert when response times deviate significantly.
Why it matters: Users abandon slow websites. Amazon found that every 100ms of latency costs them 1% in sales.
Error Rate Monitoring
We track application exceptions, 500 errors, and failed requests. A sudden spike often indicates a deployment issue, infrastructure problem, or third-party service failure.
Why it matters: Catching errors early prevents small issues from becoming major incidents.
Resource Monitoring
Server running out of disk space? Memory usage climbing steadily? These issues are predictable and preventable with proper monitoring and capacity planning.
Why it matters: Resource exhaustion leads to application crashes. Preventing it is straightforward when you have visibility.
Security Event Monitoring
Unusual traffic patterns, failed login attempts, or unexpected file changes can indicate security threats or attacks in progress.
Why it matters: Security breaches are expensive and damaging. Early detection allows early intervention.
The Human Element: Expert Response
Monitoring tools generate alerts, but expert humans interpret them and take action.
When our monitoring system detects an anomaly, our team:
- Receives instant alerts with full diagnostic context
- Assesses severity based on business impact
- Begins immediate investigation using established runbooks
- Implements fixes or escalates appropriately based on complexity
- Documents the incident including root cause and prevention steps
This expertise separates basic uptime monitoring services from professional application maintenance.
A monitoring tool might tell you “Database connection failed.” An experienced Laravel engineer knows to check connection pool configuration, recent query changes, database server resources, and network connectivity—then implements the appropriate fix.
Beyond Uptime: Business Intelligence
Our monitoring data provides valuable strategic insights:
Traffic Patterns
Understanding when your users are most active informs infrastructure scaling decisions and maintenance scheduling.
Performance Trends
Gradual performance degradation over weeks or months indicates where optimization efforts should focus.
User Behavior During Peak Times
How does your application perform when it matters most? This data guides capacity planning.
Infrastructure Cost Optimization
Are you paying for server resources you’re not using? Or running too close to capacity? Monitoring data answers these questions.
These insights help you make data-driven decisions about your application’s future, not just react to problems.
Getting Started with Professional Monitoring
Implementing comprehensive 24/7 monitoring doesn’t require migration headaches, code changes, or complex setup.
Our onboarding process:
- Initial architecture audit – We review your application structure and hosting environment
- Monitoring agent installation – Non-invasive agents installed on your servers (30 minutes)
- Threshold configuration – We establish appropriate alert levels based on your baseline performance
- Communication channel integration – Alerts sent to Slack, email, SMS, or your preferred platform
- Baseline documentation – We document current performance for future comparison
- Monitoring goes live – Full coverage begins immediately
Most Laravel applications are fully monitored within 48 hours of starting the process.
The Peace of Mind Factor
Beyond quantifiable ROI, professional 24/7 monitoring delivers something invaluable: peace of mind.
You’re not constantly wondering if your application is running smoothly. You’re not compulsively checking your phone during dinner. You’re not losing sleep over potential issues you might not know about.
You have a dedicated team of Laravel experts watching your application around the clock, ready to respond instantly to any issue.
That’s not just a service—it’s a partnership that lets you focus on growing your business instead of worrying about infrastructure.
Conclusion: Insurance Against Catastrophic Loss
At $3,499 per month, our Laravel Support & Maintenance Plan includes comprehensive 24/7 monitoring plus monthly security updates, performance optimization, and 20 hours of development time for features and improvements.
It’s not an expense—it’s insurance against the catastrophic costs of downtime.
One prevented outage pays for months of coverage.
Ready to Stop Worrying About Downtime?
Let’s talk about protecting your Laravel application with professional 24/7 monitoring. Schedule a free consultation to discuss your specific needs, or request a complimentary application audit to see exactly what we’d monitor for your system.
Your users depend on your application. Make sure someone’s always watching it.

Faheem Hasan
With over 12+ years of experience shaping high-performing web and Laravel platforms, Faheem brings strategic expertise and proven stability to enterprise technology environments. At Laracore, he leads the delivery of scalable, performance-driven Laravel solutions designed to support long-term growth and global business demands.